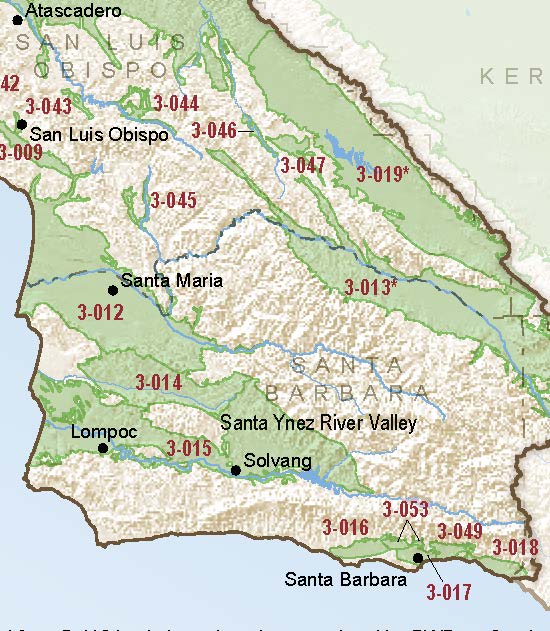
Santa Ynez River Valley
Statistics
- Basin Name
- Santa Ynez River Valley
- Basin Number
- 3-015
- SGMA Basin Priority
- Medium
- Critically Overdrafted
- No
- Hydrologic Region Name
- Central Coast
- Counties
- Santa Barbara
- Adjacent Basins
At-A-Glance
Located in California’s Central Coast hydrologic region, the Santa Ynez River Valley is 203,051 acres in size. This Medium priority basin is home to an estimated 75,446 people (2010 value). It has approximately 1499 wells, of which approximately 108 are water supply wells. Groundwater accounts for approximately 34.79 percent of the basin’s water supply.

Basin Notes
2003: Bulletin 118 basin description
2013: Santa Ynez River Watershed Report, California Department of Fish and Wildlife
2014: CASGEM Basin Prioritization: Medium
2015: Winery Ordinance Update Project, Draft EIR
2016: Basin prioritization comments – This basin is not subject to overdraft (i.e. a progressive long-term drop in water levels) because the average annual flow to the Santa Ynez River (the main recharge source) is greater than the volume of the basin. Water is extracted from this basin for municipal and agricultural uses by many entities both private and public. Source: 2012-2014_ASR FINAL.pdf 3) There was no significant change in water level or water quality during the 2009-2011 time period in the Lompoc area. As previously mentioned, water levels are balanced by releases made from Lake Cachuma, thus in essence the basin is managed to maintain water level and water quality thresholds under current operation of the reservoir. Source: Santa Barbara County Groundwater Report-2011 Salt intrusion notes – Groundwater quality is generally good for municipal and agricultural uses. There are localized areas with high TDS near the Pacific Ocean due to seawater intrusion (DWR 2004an, 2013e). Source: LTO-EIS_USBR_Chapter7-GWResources.pdf 2) Upon crossing into Section 35 West in the far western section of the Lompoc Plain water quality changes dramatically. In this area, near the coast, groundwater from the main zone exhibited TDS concentrations as high as 4,500 mg/l. Water quality in the shallow zone of the Lompoc Plain tends to be poorest near the coast and in some heavily irrigated areas of the area. TDS concentrations of up to 8,000 mg/l near the coast were measured in the late 1980s. Contamination of the main zone near the coast is thought to be due to percolation of seawater through estuary lands and upward migration of poor quality connate waters from the underlying rock. The presence of elevated boron, a constituent common in seawater supports this conclusion. …In addition, the Santa Ynez River Water Conservation District coordinates both water level and water quality measurements at 16 sites in the Lompoc area funded by local water purveyors and the County as part of the ongoing monitoring in relation to operations of Lake Cachuma. There was no significant change in water level or water quality during the 2009-2011 time period in the Lompoc area. As previously mentioned, water levels are balanced by releases made from Lake Cachuma, thus in essence the basin is managed to maintain water level and water quality thresholds under current operation of the reservoir. Source: Santa Barbara County Groundwater Report – 2011
2018: Final Basin Prioritization: Medium
2022: Three GSPs submitted to DWR
2024: January 18 – Three GSPs approved by DWR
