DWR’s Innovative Underground Aquifer Mapping Project Reaches Major Milestone: Data Now Available for Entire Central Valley

The Department of Water Resources’ (DWR) innovative Statewide Airborne Electromagnetic (AEM) Survey Project has now released AEM data for the entire Central Valley of California, marking a major milestone for the program.

Over 11,500 line-miles of AEM data were collected within the Central Valley between December 2021 and May 2022 using this helicopter-based technology that scans the earth’s subsurface. The AEM data is published on a continual basis, and the most recent release of data from the Northern Sacramento Valley completes the data release for the entire Central Valley. This remarkable dataset provides a never-before-seen continuous view of the structure below the earth’s surface in one of the most groundwater-dependent areas of the world.

Click here to read more from DWR.

NASA Measures Underground Water Flowing From Sierra to Central Valley

In a recent study, scientists found that a previously unmeasured source – water percolating through soil and fractured rock below California’s Sierra Nevada mountains – delivers an average of 4 million acre feet (5 cubic kilometers) of water to the state’s Central Valley each year. This underground source accounts for about 10% of all the water that enters this highly productive farmland each year from every source (including river inflows and precipitation).

As water grows more scarce in the Central Valley due to climate change and human use, a more detailed understanding of the natural movement of groundwater offers a chance to better protect the remaining resources.

Click here to read this article from NASA.

DWR Launches New Web-Based Mapping Tool Showing Nearly 3,000 Groundwater Sustainability Projects

From the Department of Water Resources:

A new web-based tool developed by the Department of Water Resources (DWR) will allow the public to explore thousands of groundwater projects across California to get a better understanding of one of the state’s most critical water supply resources. The virtual mapping tool is part of the State’s ongoing commitment to develop new, innovative solutions to provide information and resources to address the effects of California’s changing climate and ongoing severe drought.

The California Groundwater Projects Tool is an interactive mapping tool that allows users to explore a database of nearly 3,000 projects initiated in California over the last decade to protect groundwater resources. The mapping tool features projects that were funded by DWR and external sources such as federal or local funding. The database will include information about project benefits and effectiveness in relation to the Sustainable Groundwater Management Act (SGMA). Users can also access more than 20 project case studies and get guidance on how to measure and track benefits of projects following construction.

Continue reading from the Department of Water Resources by clicking here.

Take a tour of the Groundwater Resource Hub

From the Nature Conservancy:

Welcome to a tour of the Groundwater Resource Hub, a website full of resources where you will find guidance, tools and examples of how to manage groundwater for the environment.

Environmental users of groundwater can include, but are not limited to Groundwater Dependent Ecosystems (GDEs), Native Vegetation and Interconnected Surface Water (ISW), etc.

There are four stops on the tour:

Stop 1: Identify and Determine Impacts to the Environment

Stop 2: Consider the Environment when establishing Sustainable Management Criteria

Stop 3: Incorporate the Environment into the Monitoring Network (to fill data gaps)

Stop 4: Identify Projects and Management Actions that Maintain or Improve the environment


CA WATER COMMISSION: Update on implementation of the Sustainable Groundwater Management Act

Last year was a milestone year for SGMA, with the critically-overdrafted basins required to submit their first groundwater sustainability plans to DWR by January 31st of 2020. The Department is currently reviewing these groundwater sustainability plans and will release assessments of them this year.  By statute, the Department has two years to complete an evaluation of the plans.

At the California Water Commission’s March meeting, the commissioners received an update on how the implementation of SGMA is going from staff from the DWR’s Sustainable Groundwater Management Office.  Their presentation included the approach and timeline for releasing assessments of groundwater sustainability plans and the state’s planning technical and financial assistance supporting local SGMA implementation.

Click here to read this article.

The Basin Characterization Model—A Regional Water Balance Software Package

This report documents the computer software package, Basin Characterization Model, version 8 (BCMv8)—a monthly, gridded, regional water-balance model—and provides detailed operational instructions and example applications. After several years of many applications and uses of a previous version, CA-BCM, published in 2014, the BCMv8 was refined to improve the accuracy of the water-balance components, particularly the recharge estimate, which is the most difficult to accurately assess.

The improvement of the various water-balance components targeted the actual evapotranspiration component, which, in turn, reduced the uncertainty of the recharge estimate. The improvement of this component was enabled by the availability of a national, gridded actual-evapotranspiration product from the U.S. Geological Survey that was unique in its scope to combine remotely sensed spatial variability and ground-based long-term water-balance constraints.

This dataset provided the ability to assess monthly actual evapotranspiration for 62 vegetation types and to perform regional calibration in watersheds throughout California with the objective of closing the water balance using improved estimates for each component. The refinements, including vegetation-specific evapotranspiration, enabled the development of applications that could explore various aspects of landscape disturbance, such as wildfire, forest management, or urbanization.

The improvements to BCMv8 also provided the ability to assess long-term sustainability of water resources under a variety of management applications or future climate projections.

For more information, click here.

Take a tour of the Groundwater Resource Hub

You are invited to take a tour of the Groundwater Resource Hub, a website full of resources where you will find guidance, tools and examples of how to manage groundwater for the environment.

Environmental users of groundwater can include, but are not limited to Groundwater Dependent Ecosystems (GDEs), Native Vegetation and Interconnected Surface Water (ISW), etc. This tour will last 4 weeks, hitting your email the next four Thursdays. Each week you can delve into a specific topic relevant to incorporating the environment into Groundwater Sustainability Plans (GSPs).

The weekly schedule consists of:

March 11th: Identify and Determine Impacts to the Environment

March 18th: Consider the Environment when establishing Sustainable Management Criteria

March 25th: Incorporate the Environment into the Monitoring Network (to fill data gaps)

April 1st: Identify Projects and Management Actions that Maintain or Improve the environment

To signup to receive the remainder of the Groundwater Resources Hub Tour, email Leslie Jordan at ljordan@TNC.ORG .

OpenET: A Web Application ​to Transform Water Management in the Western United States

Environmental Defense Fund (EDF), NASA, the DesertResearch Institute (DRI) and Google announced plans today to develop a new web application called ​OpenET​ to enable western U.S. farmers and water managers to accurately track water consumption by crops and other vegetation using data from satellites and weather stations.

OpenET will fill a critical information gap in water management in the West. Today, access to accurate, timely satellite-based data on the amount of water used to grow food is fragmented and often expensive, keeping it out of the hands of many farmers and decision-makers. Water supplies in the western U.S. are critical to the health of our communities, food supply and wildlife, but they are facing increasing pressures in the face of population growth and a changing climate.

Applications of OpenET data include:

●Informing irrigation management and scheduling practices to ​maximize “crop per drop” and reduce costs for water and fertilizer​.

●Enabling water and land managers to ​develop more accurate water budgets and innovative management programs that promote adequate water supplies for agriculture, people, and ecosystems.

●Supporting groundwater management, water trading and conservation programs that increase the economic viability of agriculture across the West.

Learn more by visiting OpenETData.org

Location, location, location: New tool shows where groundwater recharge will maximize benefits

From the Environmental Defense Fund:

Recharging groundwater with rain and snowmelt is one strategy water managers are embracing to help balance groundwater supply and demand and comply with the California Sustainable Groundwater Management Act.

Depending on the location, recharge can also deliver other valuable benefits, such as additional habitat for wildlife and a more resilient water supply for people.

With support from EDF, four UC Santa Barbara graduate students have developed a new mapping tool for California’s Central Valley to identify the best locations for groundwater recharge to secure these bonus benefits.

Click here to continue reading at Growing Returns.

UPDATED TOOL: New features added to Water Tracker, a tool that displays the distribution of surface water across the Central Valley

From Point Blue Conservation Service:

With summer in full swing, it may be time to begin evaluating plans for the coming fall and winter seasons. If you are interested in learning more about the distribution of surface water across the Central Valley both in the past and in near real-time, we invite you to explore some exciting new features at Water Tracker – www.pointblue.org/watertracker

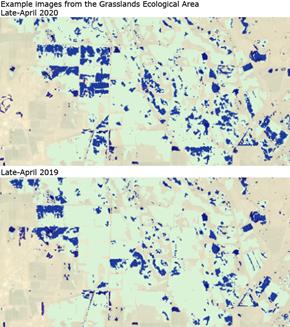
Explore wetland vegetation. Recent work by USGS provides annual maps of wetland vegetation across the Central Valley.

Two layers are available:

Wetland vegetation type, aka moist soil seed plants (swamp timothy, watergrass, cocklebur, etc.)
Habitat structure (tall emergent, open water, bare ground, etc.)

These data (2007-2017) are now available for viewing and downloading from the Map Viewer in Water Tracker. Learn more about from a recent publication led by Kristin Byrd at USGS.

Summaries of water from custom areas. You can now upload a shapefile or draw a custom spatial area and then, both download the data, AND get a summary of water in that area over time with interactive time-series plots. See an example here.

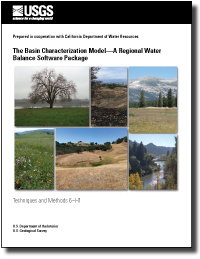
Coming soon. In the next several months we plan to make more data layers available including fallow fields (2000-2017), bird distribution/suitability (4 shorebirds, 4 waterfowl), giant garter snake distribution/suitability, groundwater recharge (based on Basin Characterization Model) and more!

What do managers need?

At the Central Valley Wetland Managers meeting in March, we shared spatial data we are currently developing, including fallow fields, wetland vegetation and types, groundwater recharge potential, bird and snake distribution/suitability maps, as well as some of the forecasting tools (within-year and long-term) in development.

A survey of participants in the meeting resulted in helpful feedback:

(1) most wetland managers’ first priority is their wetland complex
(2) for data to be most helpful for decision-making it should be made available in February/March and July/August, and
(3) visualizations and semi-custom summaries and/or reports appear to be the most appealing at this point.

We want these data and technologies to be useful and help wetland managers do their jobs, so we will be working to make sure that Water Tracker can deliver on these needs for wetland managers. Any feedback from the community is welcome. Email us at watertracker@pointblue.org to let us know what you need.

How is 2020 looking so far?

Overall, based on data from Water Tracker, the first 5 months of 2020 had, on average, 10% lower open water than the 2013-2019 average for these months. Only April had more open on the landscape water than the previous 7-year average and February had the lowest with a 17% reduction from average conditions. This is not surprising given the dry spell this winter. The estimated extent of open water in seasonal wetlands was also lower (-5%) across the first 5 months of 2020 compared to the recent 7-year average.

What is Water Tracker?

As a reminder, Water Tracker uses Landsat satellite imagery to update the distribution of open surface water in the Central Valley. It’s refreshed every 16 days. Water Tracker displays where open surface water is in the Central Valley in map form and also provides data summaries.

Anyone can quickly and easily get a picture of where the water is and isn’t, now and in the recent past. Data are available starting in 2013 (as far back as 2000 can be requested). Data can also be downloaded directly from Water Tracker.

There are a multitude of ways these data can inform decisions. Recent examples include 1) using the tool to decide on the best places to add water for the millions of waterbirds that rely on the Central Valley, and 2) to better understand the impacts of extreme drought on waterbird habitat availability.

Tell us how you are using Water Tracker

Please share your stories with us about how you are using Water Tracker at watertracker@pointblue.org. The best way for us to support this free, open-source resource is through understanding and highlighting how it is most useful.

Thank you for using and sharing Water Tracker in an effort to work towards meeting the water needs of both wildlife and people.
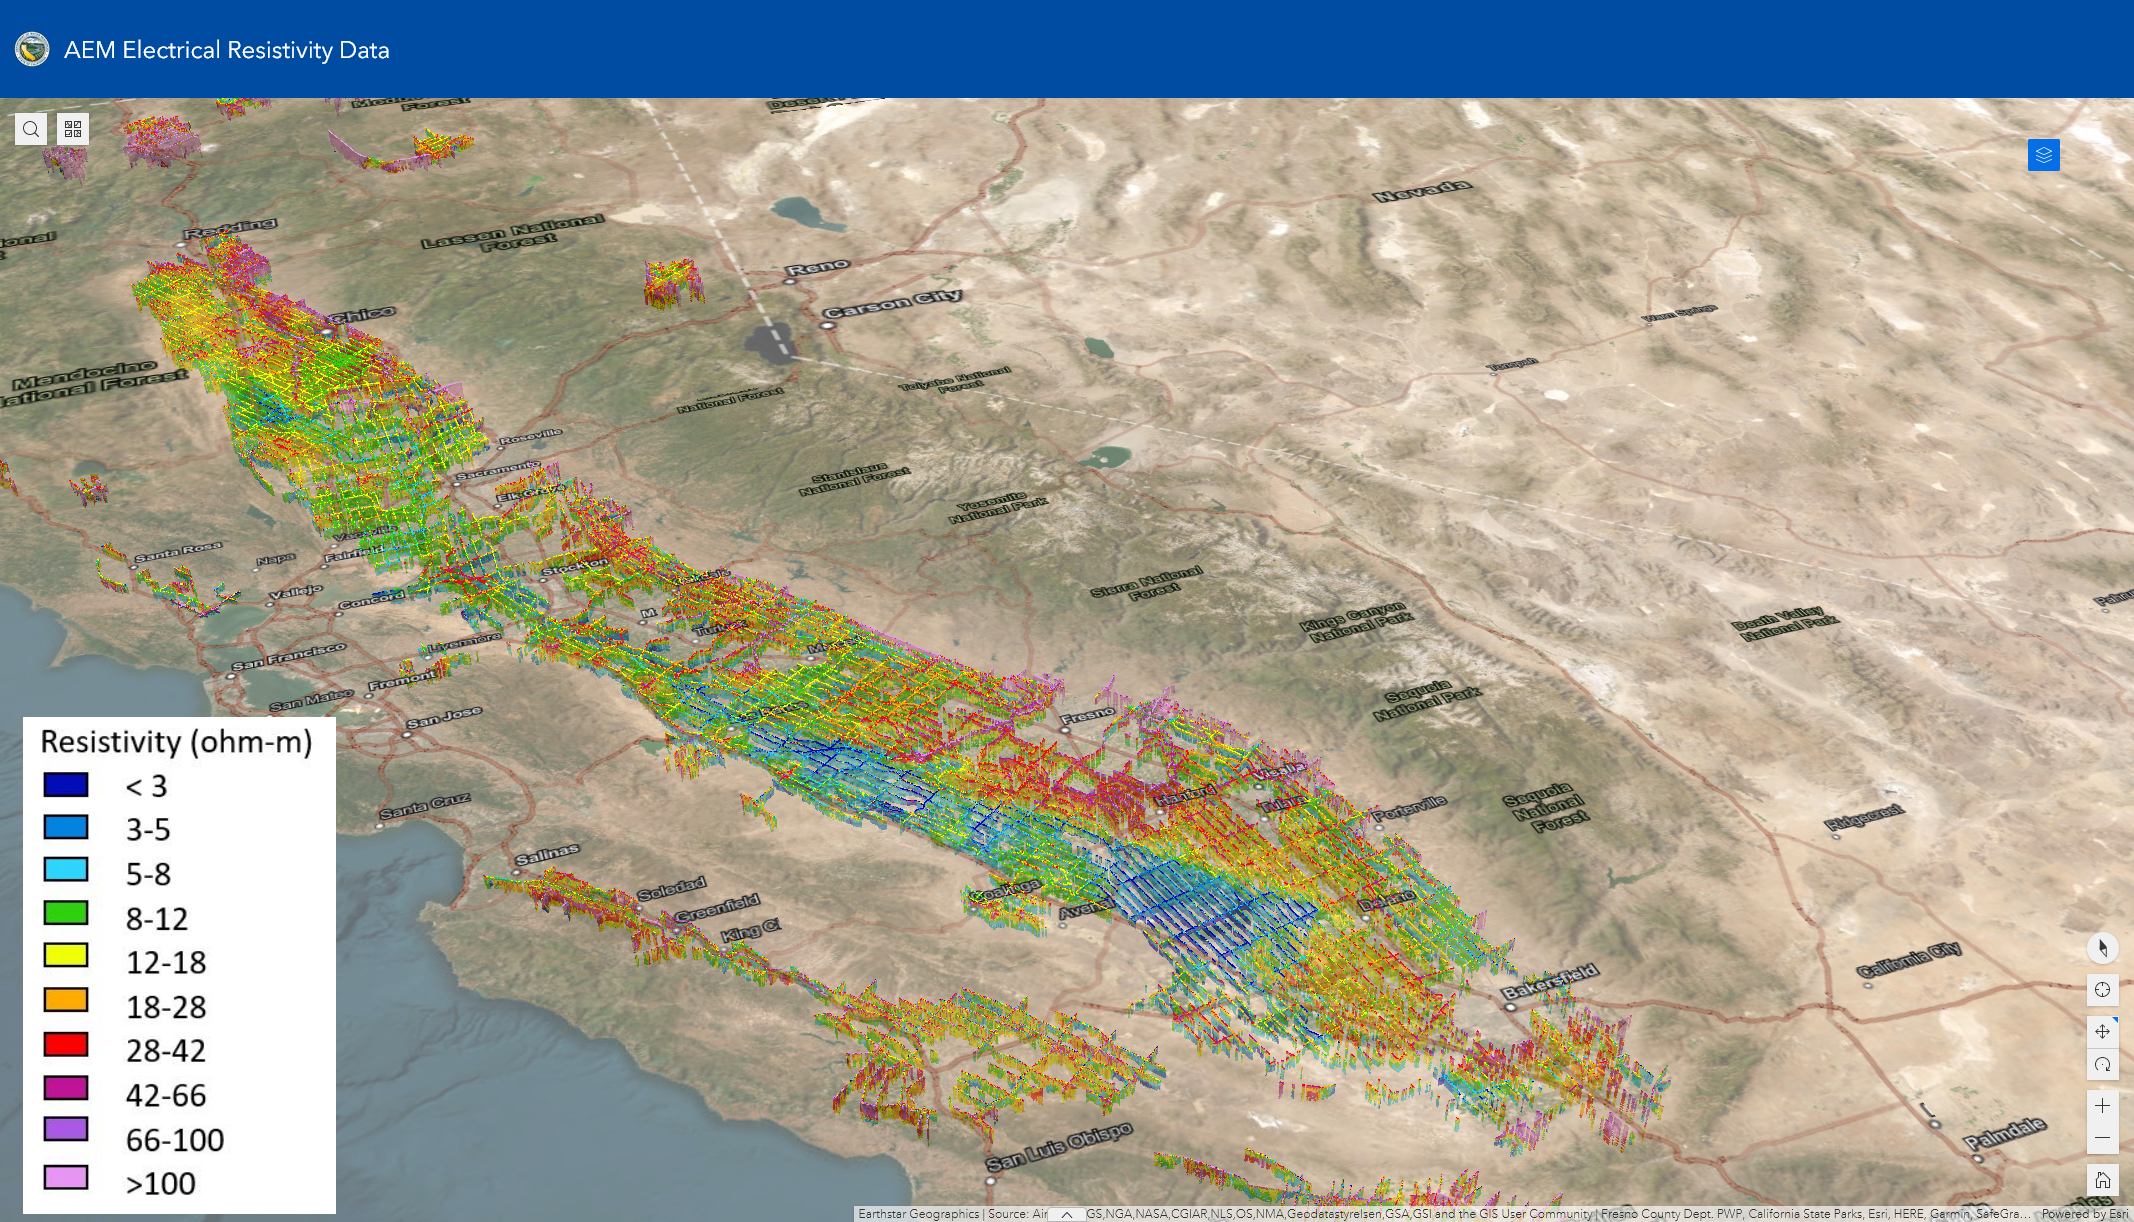
Click here for the Water Tracker Tool.